
In The Spotlight

Early bird pricing is ending soon.

MEMPHIS, Tenn., April 25, 2024 - International Paper (NYSE: IP) today reported first quarter 2024 financial results.

Tim Kirchen has been appointed Executive Vice President, UPM Raflatac.

Sales were EUR 483.7 million (542.1).

For most of Metsä Group’s business areas, the market situation in the first quarter of 2024 was stronger than at the end of the previous year.

Klabin, a leading Brazilian producer of packaging solutions, celebrates the operational launch of its highly anticipated Figueira Unit in Piracicaba, São Paulo.

British Columbia is streamlining the process for salvaging timber damaged by wildfires.

Metsä Board, part of Metsä Group, has made an investment decision to renew the folding boxboard machine at Simpele, which will improve the quality of folding boxboard and increase production efficiency.

The Manufacturing Institute Honored International Paper's Sarah Dale
Feature Articles


Top Stories
MEMPHIS, Tenn., April 25, 2024 - International Paper (NYSE: IP) today reported first quarter 2024 financial results.
Sales were EUR 483.7 million (542.1).
For most of Metsä Group’s business areas, the market situation in the first quarter of 2024 was stronger than at the end of the previous year.
Klabin, a leading Brazilian producer of packaging solutions, celebrates the operational launch of its highly anticipated Figueira Unit in Piracicaba, São Paulo.
British Columbia is streamlining the process for salvaging timber damaged by wildfires.

ICA Sweden is taking a step towards a more sustainable flower industry by replacing traditional plastic trays for flowers with molded fiber trays from Stora Enso.

April 16, 2024 - Earlier today, Forest Products Association of Canada (FPAC) President and CEO Derek Nighbor released the following statement in response to the 2024 Federal Budget tabled by Deputy Prime Minister and Minister of Finance, the Honourable Chrystia Freeland.

Cellulose packaging is booming. In recent years, we've seen the arrival - on the Quebec market - of cellulose packaging from other regions of the world.

With the ongoing momentum in corporate sustainability initiatives, the collaboration between pulp and paper companies and major corporations to create sustainable alternatives for their product lines is on the rise.

Sustainable forest management is essential to the Canadian paper packaging industry and its circular economy.

In a blog article last year, I wrote about the potential of high-temperature heat pumps (HT-HPs) to save energy in papermaking.

When looking forward at the forces that are likely to drive the direction of the pulp and paper industry over the next 15 years, decarbonization and supporting a circular economy are at the top of the list.
Colombian tissue manufacturer C.Y.P. Del R. S.A. has started up a complete AHEAD 1.8 tissue line supplied by Toscotec at its mill in Risaralda.

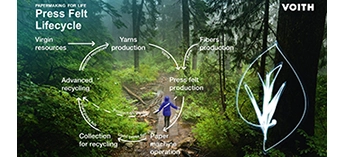
Recycling is a central component of Voith Paper’s sustainability strategy and forms the basis for a sustainable paper industry.

In an era where environmental consciousness is not just a trend but a necessity, businesses across the globe are taking significant strides towards sustainability

Benefit from the expertise of the Groupe PMI, a leader in turnkey solutions for your industrial projects and the maintenance of your process equipment.

More vacuum alone may not be the answer

Multiple-barrel pressure filters are designed to remove contaminants from a liquid filtration process while providing high cleaning efficiency, low flow restrictions, and easy maintenance.


Most read articles
- West Fraser Timber Divests Pulp Mills to Focus on Building Products
- AF&PA Releases March 2024 Packaging Papers Monthly Report
- A PM Audit May Be the Key to Improved Performance
- Radix to demonstrate key AI and IIoT benefits for the pulp and paper industry at TAPPICon 2024
- Ahlstrom Considers Closure or Sale of Parchment Plant in France
- Suzano launches construction of new tissue paper factory in Aracruz, Brazil
- West Fraser Announces First Quarter 2024 Results
- Groupe PMI: Expertise and turnkey solutions for your industrial projects
- Fires to Fiber: Accelerating Timber Salvage in British Columbia's Wildfire Zones
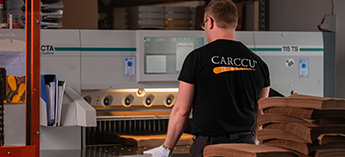
- The Finnish Paper Packaging Manufacturer Carccu® Secures Major Environmental Certifications
- New EU packaging rules are almost here. For the pulp and paper industry, legal certainty is a good thing.
- About Us
Tim Kirchen has been appointed Executive Vice President, UPM Raflatac.


Recognising the importance of recyclability for the circular economy, Sappi has established a recyclability testing laboratory within its R&D Department.


Suzano Ventures, the corporate venture capital arm of Suzano, the world’s largest market pulp producer, has made a strategic investment into the Canadian materials science startup, Bioform Technologies.


Early bird pricing is ending soon.


Upcoming events
Pulp & Beyond 2024
April 9-12, 2024
Helsinki, Finland
COFI 2024 Convention
April 10-12, 2024
Vancouver, BC, Canada
TAPPICon 2024
April 28 - May 1, 2024
Cleveland, Ohio, USA
PACWEST Conference 2024
May 29 - June 1, 2024
Jasper, Alberta, Canada
International Pulp Week 2024
June 2-4, 2024
Vancouver, Canada
LatamPAPER 2024
June 12-14, 2024
Mexico
ZELLCHEMING-Expo 2024
June 18-20, 2024
Mexico
MIAC 2024
October 9-11, 2024
Lucca, Itlay