
In The Spotlight

Recognising the importance of recyclability for the circular economy, Sappi has established a recyclability testing laboratory within its R&D Department.


In the realm of sustainable solutions, UPM emerges as a frontrunner, investing strategically in the biochemical industry. This move isn't just about business; it's a testament to their commitment to a future less reliant on fossil fuels.

Between 2012 and 2022, the number of people in the EU working in the manufacture of paper and paper products industry increased by 10.9%.

The new tissue machine is supplied by RePlus Tissue

A major milestone has been reached in a global innovation project aimed at investigating the feasibility of recycling biogenic CO2 emissions and using it in the manufacturing of household products.

Shutdown of operations at Raubling Papier GmbH under review

Green Bay Packaging proudly announces the promotion of Tom Short to Business Development Manager for National Account Sales.

Metsä Board, part of Metsä Group, inaugurated its upgraded folding boxboard machine in Husum, Sweden, on the 11th of April.
Feature Articles


Top Stories

PulPac was founded on the ambition of doing well by doing good – while having fun. Now, we are putting this ambition into words in our very first Impact Report.

Wellpappe Alzenau, a Palm Group packaging plant, has taken a significant step towards sustainability by adding two fully electric Mercedes E-trucks (E-Actros) to its fleet.

The ownership dispute over Skeena Sawmills and Skeena Bioenergy pellet plant continues to unfold in a Vancouver Supreme Court, following the businesses' placement into receivership due to overwhelming debts.
Between 2012 and 2022, the number of people in the EU working in the manufacture of paper and paper products industry increased by 10.9%.
A major milestone has been reached in a global innovation project aimed at investigating the feasibility of recycling biogenic CO2 emissions and using it in the manufacturing of household products.

With the ongoing momentum in corporate sustainability initiatives, the collaboration between pulp and paper companies and major corporations to create sustainable alternatives for their product lines is on the rise.

Sustainable forest management is essential to the Canadian paper packaging industry and its circular economy.

In a blog article last year, I wrote about the potential of high-temperature heat pumps (HT-HPs) to save energy in papermaking.

When looking forward at the forces that are likely to drive the direction of the pulp and paper industry over the next 15 years, decarbonization and supporting a circular economy are at the top of the list.

In many industrial sectors, a shortage of personnel is a concerning reality. Companies struggle to find and retain skilled workers, leading to increased pressure on those already in position. In this context, enhancing workforce value and applying the TPM principle can play a crucial role in attracting and retaining workers.

The global pulp market has seen its fair share of ups and downs, making it a highly volatile and unpredictable industry.
The new tissue machine is supplied by RePlus Tissue

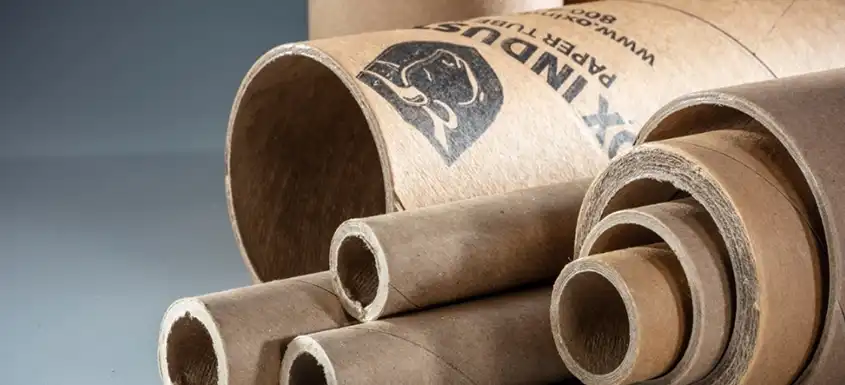
The crush strength of the core refers to the capacity of a material to withstand pressure.

Corrugator operators run their machines based on data, experience, and conventional wisdom.

Valmet is taking process automation further by introducing the next-generation distributed control system (DCS), the Valmet DNAe.

Mondi Dynäs had experienced an unacceptable level of incidents for several years. Many traditional safety activities were initiated but did not translate to fewer accidents.

International technology group ANDRITZ is responding to the pulp and paper producers’ need to meet their process efficiency and environmental sustainability targets by launching a portfolio of intelligent instruments called the Smart Series at the Pulp & Beyond exhibition in Helsinki on April 11.


Most read articles
- Lake Babine Nation and West Fraser Join Forces for Sustainable Forestry Management in British Columbia
- Paper Mill Funding Returned After Restart Fails
- Georgia-Pacific's Alabama River Cellulose Investment Primed to Make Local and Industry Impact
- Green Light for Packaging Giant: EU Approves Smurfit Kappa-WestRock Merger
- Georgia-Pacific Investing More than $150 Million to Grow Consumer Tissue Business
- Climate Change: A Double-Edged Sword for Mountain Pine Beetles
- Canfor Announces Restructuring to Position Alabama Operations for the Future
- New COFI Economic Impact Study Affirms Forest Industry Vital To Provincial Economy
- Strengthening Resolute’s Collaborations with Indigenous Communities
- What is Crush Strength for Paperboard Cores?
- Sustainable Solutions: Collaborations between Major Brands and Pulp and Paper Companies
- In the EU Clean Transition Dialogues, the pulp and paper industry has been heard, and wants to stay engaged
Green Bay Packaging proudly announces the promotion of Tom Short to Business Development Manager for National Account Sales.


Recognising the importance of recyclability for the circular economy, Sappi has established a recyclability testing laboratory within its R&D Department.


In the realm of sustainable solutions, UPM emerges as a frontrunner, investing strategically in the biochemical industry. This move isn't just about business; it's a testament to their commitment to a future less reliant on fossil fuels.


Time Tested, Future Forward: Celebrating Corrugated’s Storied Past and Bright Future


Upcoming events
Pulp & Beyond 2024
April 9-12, 2024
Helsinki, Finland
COFI 2024 Convention
April 10-12, 2024
Vancouver, BC, Canada
TAPPICon 2024
April 28 - May 1, 2024
Cleveland, Ohio, USA
PACWEST Conference 2024
May 29 - June 1, 2024
Jasper, Alberta, Canada
International Pulp Week 2024
June 2-4, 2024
Vancouver, Canada
LatamPAPER 2024
June 12-14, 2024
Mexico
ZELLCHEMING-Expo 2024
June 18-20, 2024
Mexico
MIAC 2024
October 9-11, 2024
Lucca, Itlay